Have you ever visited a website and wondered, “How did they make that button look so good?” or “Why is this page loading so slowly?” Maybe you’re starting your journey into web development, and code on a screen feels abstract and distant. What if I told you that the answers to these questions, and a powerful gateway to understanding the web, are already built into your browser?
It’s called Chrome Developer Tools, or DevTools for short. It’s a Swiss Army knife for anyone curious about how the internet works. For developers, it’s an indispensable part of the daily workflow. For marketers, designers, and content creators, it’s a secret window into the mechanics of a website. And the best part? It’s incredibly easy to access.
In this guide, you’ll learn exactly how to enable developer tools in Chrome, and more importantly, we’ll take a deep dive into what you can do once they’re open. We’ll move beyond simple activation and explore the practical, powerful features that can help you diagnose problems, test ideas, and truly see the web in a new light. Let’s get started.
What Exactly Are Chrome Developer Tools?
Before we jump into the “how,” let’s quickly cover the “what.” Chrome DevTools is a set of web developer tools built directly into the Google Chrome browser. Think of it as an X-ray machine or a control panel for any webpage you visit. It allows you to:
- Peek under the hood: View the raw HTML, CSS, and JavaScript that make up a site.
- Test and experiment: Change code in real-time to see how it affects the page, without saving anything.
- Diagnose problems: Find out why something is broken or looks wrong.
- Optimize performance: Identify what’s slowing down a website.
According to the 2023 Stack Overflow Developer Survey, over 65% of professional developers use Chrome as their primary browser, largely due to the power and ubiquity of its DevTools. This isn’t just a niche tool; it’s the industry standard.
How to Enable Developer Tools in Chrome: Three Simple Methods
Enabling DevTools isn’t a settings toggle you have to hunt for. Instead, you “open” or “launch” them. There are several quick ways to do this, and each one is useful in different scenarios. You can try these right now on any webpage.
Method 1: The Quick Right-Click (Inspect)
This is the most common and intuitive method.
- Navigate to any website in Chrome.
- Move your mouse over any element on the page, a heading, an image, a button.
- Right-click on that element.
- From the context menu that appears, click “Inspect.”
Result: The DevTools panel will snap open, usually at the bottom or right side of your browser window. The best part? It will automatically highlight the HTML code for the exact element you right-clicked on. This is your fastest path to understanding a specific part of a page. For more deep dives into Unlocking Your Browser: A Practical Guide to Chrome Developer Tools explore Maruti Techlabs.
Method 2: The Keyboard Shortcut (The Power User’s Choice)
For speed and efficiency, nothing beats a keyboard shortcut.
- Windows/Linux: Press Ctrl + Shift + I
- Mac: Press Cmd + Option + I
Result: This action instantly opens the DevTools panel, ready for you to start working. If you’re going to be using DevTools frequently, this is the method you’ll want to memorize. Alternatively, pressing the F12 key also works on most Windows systems.
Method 3: The Main Menu Route
If you prefer using menus, this method is straightforward.
- In the top-right corner of your Chrome window, click the three vertical dots (Menu).
- Navigate to More Tools.
- From the submenu that appears, select Developer Tools.
Result: Just like the other methods, this will open the DevTools panel. It’s a reliable fallback if you ever forget the keyboard shortcuts.
Now that you’ve successfully opened DevTools, you might be looking at a panel full of tabs like “Elements,” “Console,” and “Sources,” and feeling a bit overwhelmed. Don’t worry. Let’s break down the most useful panels and what you can do with them.
A Tour of the Essential DevTools Panels
Understanding the different sections of DevTools is key to using it effectively. We’ll focus on the panels you’ll use most often.
The Elements Panel: Your HTML and CSS Playground
The Elements panel is likely where you’ll spend most of your time. It shows you the Document Object Model (DOM), the live, structured representation of the page’s HTML.
On the left, you see the HTML. You can click its attributes. On the right, you see the Styles pane, which shows all the CSS rules applying to the selected element. For more on The Ultimate Toolkit for Freelance Developers in 2025, explore our guide on gillibilli.shop.
What can you do here?
- Edit HTML in Real-Time: Double-click on any text or tag within the HTML viewer and change it. You’ll see the update on the page immediately. This is perfect for testing copy changes or fixing a typo you spot on your live site before making the actual change in your code editor.
- Modify CSS on the Fly: In the Styles pane, you can click on any CSS property or value and change it. You can change colors, fonts, margins, padding, and more. You can also uncheck the checkbox next to a property to temporarily disable it. This is an incredible way to experiment with designs without committing to a change.
- Visualize the Layout: The Styles pane also includes a detailed box model diagram. This shows you visually how much margin, border, padding, and content space an element is taking up, which is crucial for debugging layout issues.
The Console Panel: The JavaScript Command Center
The Console is your direct line of communication with the JavaScript on the page. It serves two primary purposes:
- Displaying Log Messages and Errors: When a developer uses console.log() to debug their code, the messages appear here. If there’s a JavaScript error on the page, it will be displayed here in red. This is the first place to look when something interactive isn’t working.
- Executing JavaScript Commands: You can type any JavaScript code directly into the Console and press Enter to run it. For example, you could type document.body.style.backgroundColor = “lightblue”; to change the page’s background color instantly.
It’s a powerful sandbox for testing snippets of code and interacting with the page programmatically.
The Sources Panel: For Debugging JavaScript
As you move from editing styles to writing interactive code, the Sources panel becomes your best friend. This is where you can debug your JavaScript.
You can view all the source files that the webpage has loaded. More importantly, you can set breakpoints. A breakpoint is like a pause button for your code; it tells the browser, “Stop executing JavaScript when you reach this specific line.” This allows you to inspect what’s happening at that exact moment, what are the variable values? Is the code taking the path you expected? It’s the most powerful way to find and fix logic errors in your scripts.
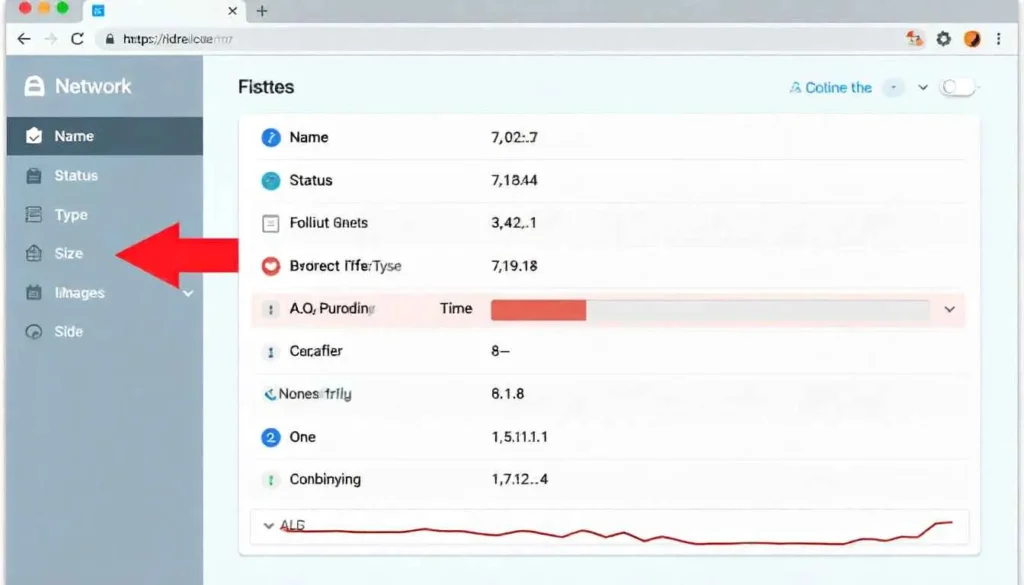
The Network Panel: Seeing What’s Loading
Have you ever stared at a browser spinner, wondering what’s taking so long? The Network panel has the answers. It records every single network request your browser makes to load the page: HTML files, CSS stylesheets, JavaScript files, images, API calls, and more.
Each request is shown as a row in a table, with crucial information like:
- Status: Was the request successful (200) or not (404)?
- Type: What kind of file was requested?
- Size: How large is the file?
- Time: How long did it take to download?
By analyzing this data, you can pinpoint which resource is causing a slowdown. For instance, you might discover that an unoptimized image is several megabytes and is blocking the page from rendering quickly. This data is vital for web performance optimization, a critical factor for user experience and SEO. In fact, Google uses site speed as a ranking factor, making this panel a key tool for developers and site owners alike.
The Application Panel: Managing Storage
The modern web uses your browser as a storage space. The Application panel lets you see and manage this stored data. Here, you can inspect:
- Local Storage & Session Storage: Key-value pairs that websites use to save data on your machine.
- Cookies: The small pieces of data that sites use to remember you.
- Cache: Files that are stored to make repeat visits faster.
This is essential for testing how your site behaves with different stored states and for debugging login or personalization issues.
Putting It All Together: A Real-World Debugging Walkthrough
Let’s imagine a common scenario. You’re working on your website, and you notice that a “Sign Up” button isn’t centered properly on the page. Here’s how you’d use DevTools to diagnose and fix the problem.
- Open DevTools: Right-click on the misaligned button and select Inspect. The Elements panel opens, with the HTML for your button highlighted.
- Analyze the Styles: Look at the Styles pane on the right. You see a CSS rule for the button that includes margin: 0 auto, which should center it, but it’s not working.
- Identify the Issue: As you scan the Styles pane, you notice that the display property is set to inline-block. An inline-block element won’t respect auto margins for centering. The CSS that should be centering it is effectively useless.
- Test the Fix: In the Styles pane, you click to add a new CSS property. You type display: block; and press Enter. Instantly, the button snaps into a centered position. It works!
- Implement the Fix Permanently: Now that you’ve confirmed the solution in the browser, you can go to your actual CSS file in your code editor and make the same change.
This entire process of investigation and testing took less than a minute, all thanks to the real-time feedback from DevTools.
Beyond the Basics: Tips for Effective Use
To truly integrate DevTools into your workflow, keep these tips in mind:
- Device Toolbar: Click the phone/tablet icon in the top-left of DevTools to simulate different screen sizes and test your website’s responsive design.
- Command Menu: Press Ctrl+Shift+P (or Cmd+Shift+P on Mac) to open a command palette. You can search for any DevTools feature here, making it easy to find settings and actions without hunting through menus.
- Changes are Temporary: Remember, any changes you make in DevTools are lost when you refresh the page. It’s a testing environment, not a code editor. Always copy your working changes back to your source files.
Conclusion: Your Gateway to Web Mastery
Learning how to enable developer tools in Chrome is more than just a technical step; it’s about unlocking a new way of seeing and interacting with the digital world. It transforms the web from a static collection of pages into a dynamic, living system that you can explore, understand, and even manipulate.
Whether you are a seasoned developer debugging a complex JavaScript issue, a designer fine-tuning a pixel-perfect layout, or simply a curious mind wanting to know how things work, DevTools is your most valuable companion. It demystifies the process of building for the web and empowers you to create, fix, and improve with confidence.
So, the next time you’re on a webpage, try right-clicking and hitting “Inspect.” You’ve just opened a door to a world of possibilities. Happy exploring!
All images are generated by Freepik.
Frequently Asked Questions (FAQs)
The fastest way is to press F12 or Ctrl+Shift+I (on Windows/Linux) or Cmd+Option+I (on Mac). This will instantly open the DevTools panel.
No, the changes you make in DevTools are only temporary and exist only in your browser’s memory. As soon as you refresh the page, all your edits will be lost. You must copy your changes to your actual source code files for them to be permanent.
Non-developers can use DevTools for many practical tasks! You can check why a webpage looks broken on your screen, see the exact dimensions and colors of an element for a design mockup, or even temporarily hide an element to take a cleaner screenshot.
Generally, yes, when you are on a reputable site. However, you should never paste and execute code from an untrusted source, as it could potentially be malicious. Use the Console with the same caution you would use when running any unknown program.
Open the Network panel in DevTools and then reload the page. The panel will capture and display a timeline of all loaded resources. You can see which files are the largest and which take the longest to load, helping you identify performance bottlenecks.
Pingback: Essential Xcode Developer Tools: Curating Your Powerhouse iOS Toolkit